How to Measure Marketing Success
How do you figure out if your advertising is working?
If you’re making more money from it than you’re spending… obviously.
But more detailed than that.
How do you figure out what the weak links are so you can fix them?
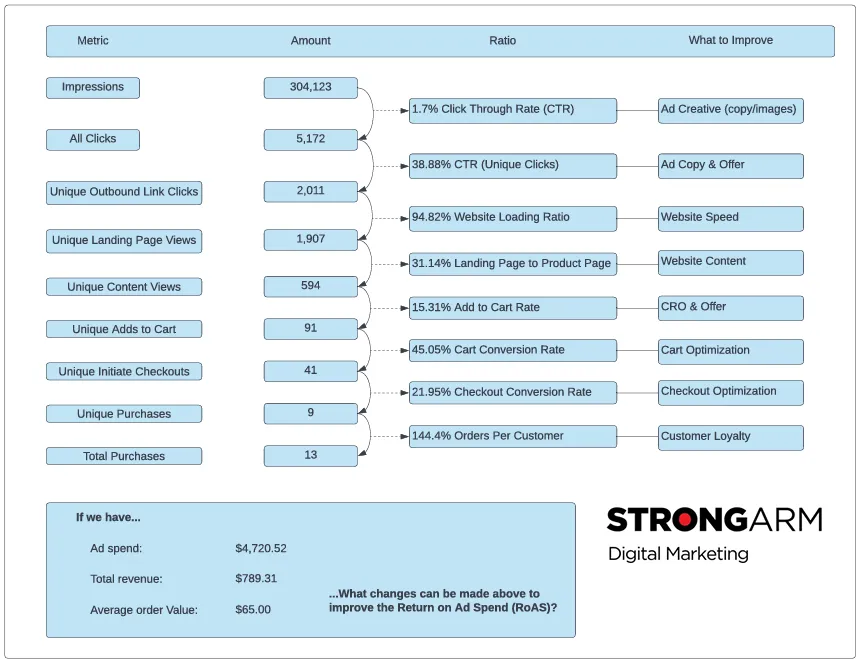
You need to chart it out and look at the numbers (cue the picture below).
I made this as an educational piece to speak on in a networking group I’m in last fall - and now I’m giving it to you guys to use as you need.
But you’ve got to know how to do that for this to make sense.
Below, I’ll write out how you can use this to think about your own marketing funnel.
You DON’T want to just mirror what’s below.
Because every funnel is a little different.
HOWEVER, understanding the thought process going on here will let you take the underlying principles of the funnel outlined in this diagram, and apply it to your situation so that you can figure out the weak links in your own marketing, and fix them.
Let’s get started
This example is specifically looking at an ecommerce facebook advertising campaign.
We want to look at each metric, the numbers it is bringing in, and where the biggest “leaks” are in the funnel.
We have 9 metrics in this example.
Those are:
Impressions
All Clicks
Unique Outbound Link Clicks
Unique Landing Page Views
Unique Adds to Cart
Unique Initiate Checkouts
Unique Purchases
Total Purchases
To the right of that, we have the volume/numbers for each of those metrics.
The difference between each “step” metric in the funnel makes up the micro conversion rate.
(Yes, there are different types of conversions - small steps that lead people towards a sale are micro conversions. We want to measure these. The big goal at the end, the sale, is a macro conversion.)
Let’s define those metrics so we can make more sense of this.
Impression: How many views your ad has received.
All Clicks: The total number of clicks on your ad (regardless of if a single person clicks multiple times, or clicks in different ways such as going to your website or going to your facebook page).
Unique Outbound Link Click: The number of clicks taking people away from Facebook (most likely, to your website). A single person clicking 3 times only counts as “1,” here.
Unique Landing Page Views: How many people have loaded your landing page (website page) after giving a Unique Outbound Link Click. (if there is a difference between this and your outbound link click, you will want to work with your website developer to fix page loading speed issues.)
Unique Content Views: The number of people who spent time on your landing page / website after giving you a Unique Outbound Link Click. This is different from Unique Landing Page Views in that this measures the people who stuck around and spent time looking at your website/landing page, not simply loading it and leaving.
Unique Adds to Cart: How many people added an item to their cart to purchase - exclusively looking at those who have done this after clicking on your ad.
Unique Initiate Checkouts: How many people have begun the checkout process on your site, of those that came from your ad.
Unique Purchases: How many people have complete purchases, where the interaction began with your ad.
Total Purchases: The number of purchases made, on average, by person which came from your ad.
What do we do with these?
We look at the ratios.
In this example, the ad has been seen 304,123 times, and has been clicked on 5,172 times.
That means the ad has been clicked on 1.7% of the time that it is seen. That’s the Click Through Rate (CTR).
In the same way that “All Clicks” Goes into “Impressions,” “Unique Outbound Link Clicks” goes into “All Clicks.” And so on the whole way through the chart.
Once we have those percentage numbers, we can begin to isolate items to test.
For example, if lots of people see our ad, but very few click (1.7% is a low CTR), we should try testing new images in our ad, changing the ad copy (words on the ad), or try different audience targeting settings.
So, how would the chart look different if we made these changes, and came away with a 3% CTR, almost double the 1.7% CTR?
That would increase the All Clicks number from 5,172, to 9124 - nearly 4,000 more people clicking on our ad.
But that’s not what we’re after - we want sales, not clicks.
So, if the other ratio figures (percentages) are consistent, they won’t change just from putting more people through them. The 38.88% Unique Click CTR will stay the same, and so will the 94.82% Website Loading Ratio.
So, let’s run the numbers of what the purchases number looks like after reaching that 3% CTR.
Impressions: 304,123
All Clicks (with a 3% CTR): 9124
Unique Outbound Link Clicks: 3547
Unique Landing Page Views: 3363
Unique Content Views: 1047
Unique Adds to Cart: 160
Unique Initiate Checkouts: 72
Unique Purchases: 16
Total Purchases: 23
That 1.3% CTR increase from adjusting our ad resulted in 7 more customers (16 instead of 9) and 10 additional sold items (23 instead of 13).
So… Do the same for your business.
You may not be doing ecom sales on Facebook, but you likely are running ads on some platform, getting leads from those ads, and trying to sell them over the phone or in person.
Chart out your funnel the same way, do the math to what your ratios are, identify where you’re hurting/can improve - and start adjusting that part of your funnel until it performs better.